
User Guide
Dashboard & KPIs
Read your business at a glance — KPI cards, revenue and status charts, a 90-day cash-flow forecast, AI Insights and Quick Actions.
The Dashboard is your home screen. It rolls up every invoice and payment into a few cards and charts so you can see — in seconds — how much you've billed, what's been paid, and what's still outstanding.
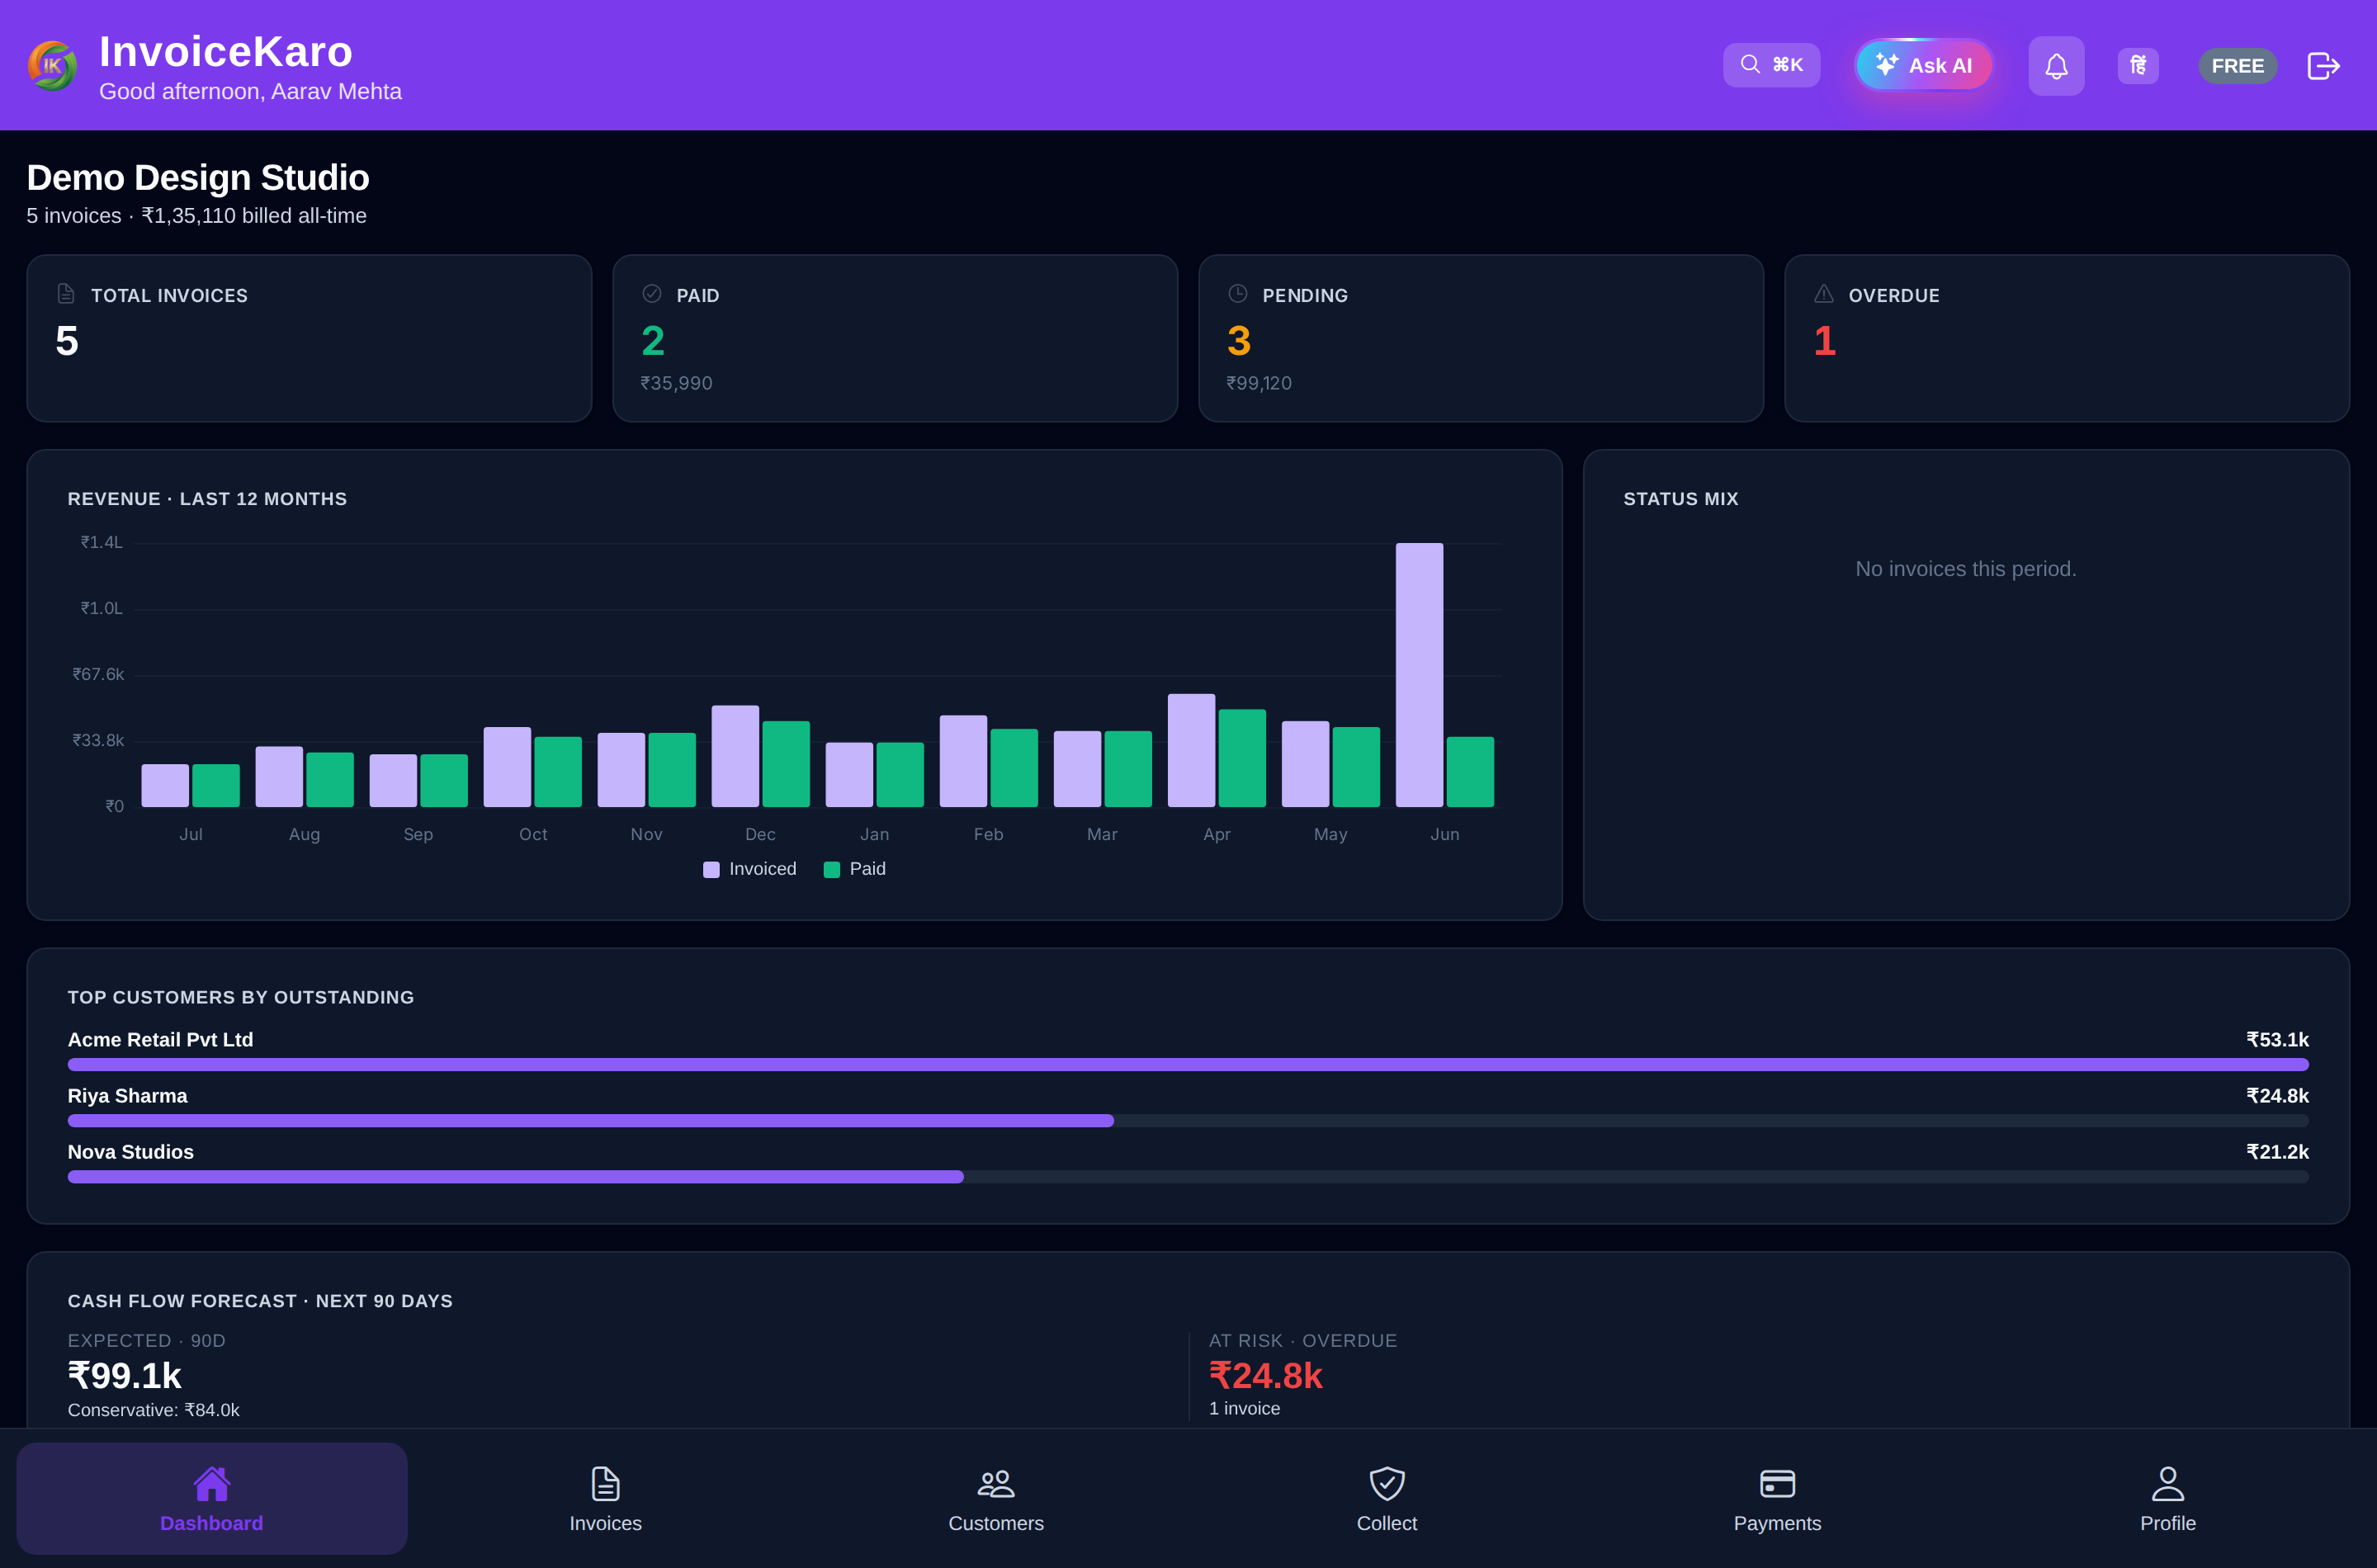
KPI cards
Four headline cards sit at the top of the dashboard and update the moment an invoice changes status.
| Card | What it tells you |
|---|---|
| Total Invoices | Every invoice you've created, across all statuses. |
| Paid | Invoices you've marked as paid — money already in your account. |
| Pending | Sent invoices still awaiting payment, but not yet past their due date. |
| Overdue | Sent invoices that are past their due date — the ones to chase first. |
Charts & trends
- Revenue (12-month chart) — your billed or collected revenue month by month, so you can spot seasonality and growth.
- Status donut — the share of invoices that are paid, pending and overdue at a glance.
- Top customers by outstanding — who owes you the most, so you know which receivables to chase.
90-day cash-flow forecast
The 90-day cash-flow forecast projects money expected to land over the next quarter, based on your outstanding invoices and their due dates. Use it to plan spending and spot a dry patch before it hits.
AI Insights & Quick Actions
AI Insights surfaces plain-language observations about your numbers — for example which clients are slipping or where collections are lagging. To go deeper, open the Ask AI drawer and ask follow-up questions about the current view; see The AI assistant.
Quick Actions tiles let you jump to the most common jobs — create an invoice, add a customer, scan a bill, or jump to your invoices, customers and payment tracking — without hunting through tabs.